In February 2012 I wrote an article on the seawater sample collecting from the BC lighthouses here My story discussed the duties and .trials a lightkeeper had while obtaining the samples. This story details the use of the information collected from a scientist’s point of view.
********************************
The Lighthouses of British Columbia
Not only are British Columbia’s lighthouses picturesque, and important for navigational purposes, but they also collect oceanographic data! You can access sea surface temperature (SST) and surface salinity data at the following website:
www.pac.dfo-mpo.gc.ca/science/oceans/data-donnees/lighthouses-phares/index-eng.htm
This website also has photographs of the lighthouses. (See below.)
 Figure 1. Race Rocks (48.180 N, 123.320 W). Photo credit: Fisheries and Oceans Canada. Photograph obtained from: http://www.pac.dfo-mpo.gc.ca/science/oceans/data-donnees/lighthouses-phares/index-eng.htm
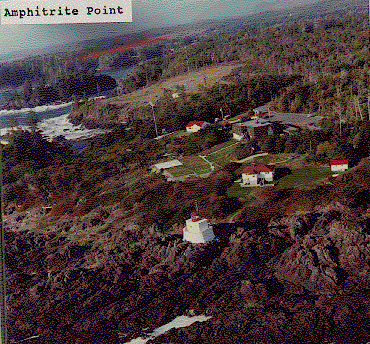
 Figure 2. Amphitrite Point (48.550 N, 125.320 W). Photo credit: Fisheries and Oceans Canada. Photograph obtained from: www.pac.dfo-mpo.gc.ca/science/oceans/data-donnees/lighthouses-phares/index-eng.htm
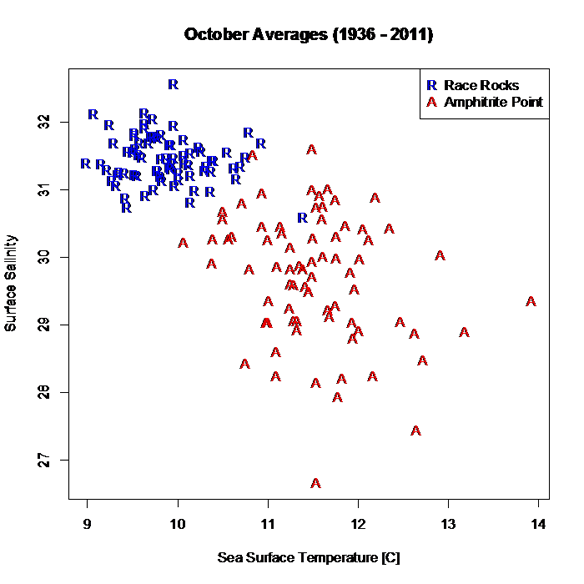
I’ve compiled and plotted some of the data from the Race Rocks and Amphitrite Point lighthouses. Race Rocks (Figure 1) is near Victoria, while Amphitrite Point (Figure 2), on the west coast of Vancouver Island, is closer to Bamfield. The data plotted in Figure 3 are monthly averages for October, covering the years 1936 to 2011. The plot shows an evident contrast in SST and surface salinity between the two sites.
 Figure 3. October averages for surface salinity plotted versus October averages for sea surface temperature. The data are from two different lighthouses: Race Rocks (48.180 N, 123.320 W) and Amphitrite Point (48.550 N, 125.320 W). Race Rocks is near Victoria, while Amphitrite Point is on the west coast of Vancouver Island. Data are not plotted for 1940 and 2007, because of missing values. Graphics produced with R (R Core Team, 2012). Data source: Fisheries and Oceans Canada, www.pac.dfo-mpo.gc.ca/science/oceans/data-donnees/lighthouses-phares/index-eng.htm (accessed Oct. 9, 2012).
A peculiarity of the lighthouse data is that they are not collected at the same time every day, as explained on the lighthouse data website: “Sampling occurs at or near the daytime high tide” (Fisheries and Oceans Canada, 2012).
If you want data for ocean bottom temperature and salinity (as opposed to surface temperature and salinity), such data are available through NEPTUNE Canada, and through the VENUS network (NEPTUNE Canada, 2012; VENUS, 2012).
Citations
Fisheries and Oceans Canada. 2012. Website. Accessed Oct., 9, 2012:http://www.pac.dfo-mpo.gc.ca/science/oceans/data-donnees/lighthouses-phares/index-eng.htm
NEPTUNE Canada, 2012. Website: www.neptunecanada.com
R Core Team, 2012. R: A language and environment for statistical computing. R Foundation for Statistical Computing, Vienna, Austria.
VENUS network, 2012. Website: www.venus.uvic.ca
